Tornado Impact Data: Visualizations by Andrea S. Johnson
Tornado Geography
The National Weather Service also classifies tornado events to include location data. By using Choropleth maps with GeoJSON, we can represent the data overlayed on a Google map of the United States.
After first looking at only the unadjusted number of tornado events, we decided to more accurately represent the average frequency by a factor of count per 10,000 square miles. Considering Texas is large and Indiana is small, it better represents the impact of tornado events on the population.
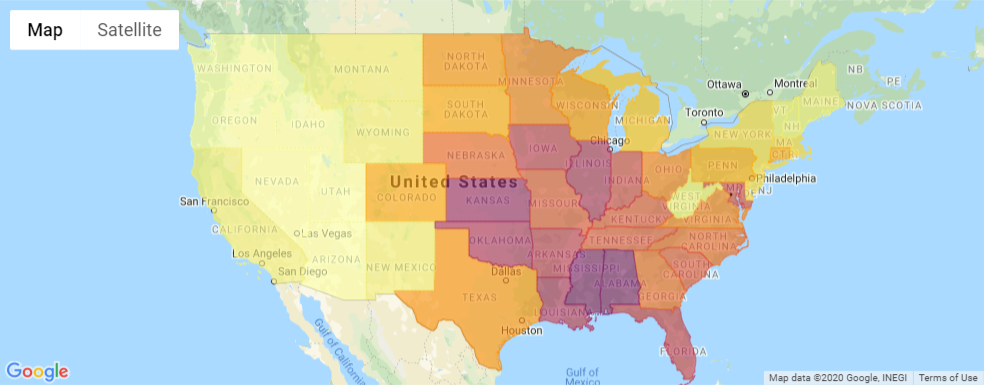
Average Annual Tornado Events
per 10,000 sq miles
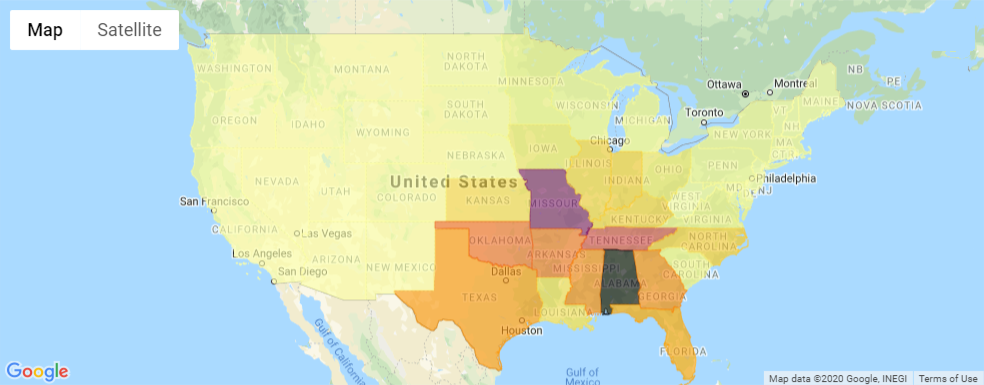
Total Fatalities by State
Questions Answered
- What is the most common area of the United States impacted by tornado events?
- Do tornado events impact some states more severely than others?
- How does Indiana rank among other states for tornado frequency and impact?
 Data Analytics Bootcamp
Please check out more information in our GitLab Project repository.
Data Analytics Bootcamp
Please check out more information in our GitLab Project repository.
Conclusions:
The first plot only represents the count of the annual tornado events. In other words, it shows the average annual frequency of tornado events (equalized by the State area) for the entire country. Indiana is ranked 19th for the average annual events. However, Indiana ranks 11th for the average annual events per 10k square miles.
On the above map, we can clearly see "Tornado Alley", the area of the United State where tornadoes are most frequent. Indiana also ranks 11th for the total number of tornado fatalities. Based on all of the impact measurements, we can safely represent that tornado severity is often worse for southern States.