Tornado Impact Data: Visualizations by Andrea S. Johnson
Tornado Frequency
The National Weather Service data aggregates measurements for each individual tornado event. A tornado event is defined by a touchdown and a path. Therefore, one storm cell could cause many tornado events depending on the behavior.
By counting the number of tornado events, we can gauge the frequency of tornadoes in a given year and compare that against the other measurements of impact.
Questions Answered
- How does the frequency of Tornadoes look over time?
- Are the Measurements of Impact correlated with the frequency?
Conclusions:
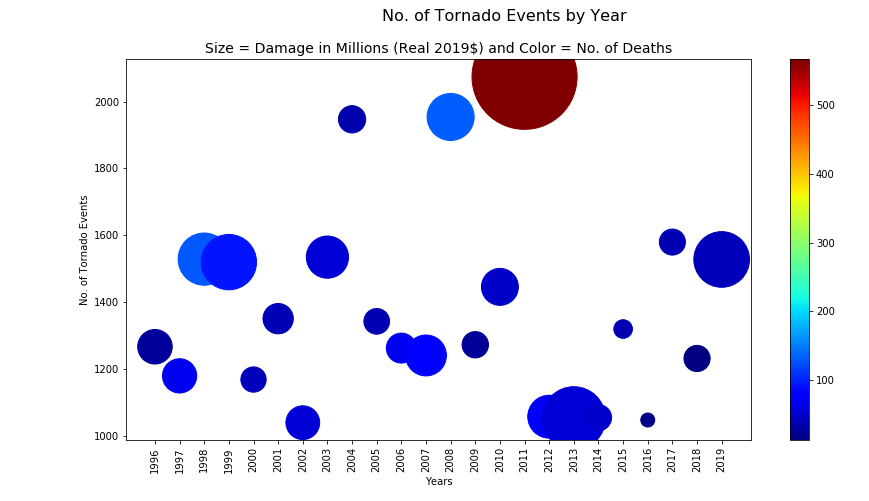
Represented in the scatter plot above, the frequency of tornado events is plotted on the x-axis. Then, the measurements of impact are represented by the size of the bubble, for amount of property damage, and by the color of the bubble, for the amount of deaths.
We can see that the frequency and impact are NOT directly correlated. In 2013, there were fewer tornado events, but the damage bubble was much bigger. In 2004, there were many tornado events, but the damage bubble is very small.